
Why do we need service desk reports?
Read our guide on Why do we need service desk reports? on the Appsvio blog.

How many times have you heard that data is powerful? Because it is. So why not use information that we already have in the service desk and use them to streamline ITSM decisions, boost customer support experience and keep an eye on agents’ performance.
Let’s use data to create effortless, business-ready service desk reports that can help you with managing a team and support rational decision-making.
How to create a report in Jira Service Management?
To create an ITSM report you need an extension like ITSM Reports – Charts, Graphs and Dashboard Gadgets for Jira Service Management – brand new ITSM app by Appsvio.
Thanks to that, you can use already existing data and turn it into powerful metrics that can help you to manage your team, agents and to turn your business in the right direction.
With this app, that is focused strictly on the service desk information, you can create reports right in native Jira dashboard you probably already know. Metrics are available in gadgets, and you can have current data at your fingertips without extra screens.
Gain already analyzed and ready to present data at hand 👌
What service desk data can you use?
The key is to acquire the right data. What service desk metrics can help you with eliminating bottlenecks and staying ahead of heading down results?
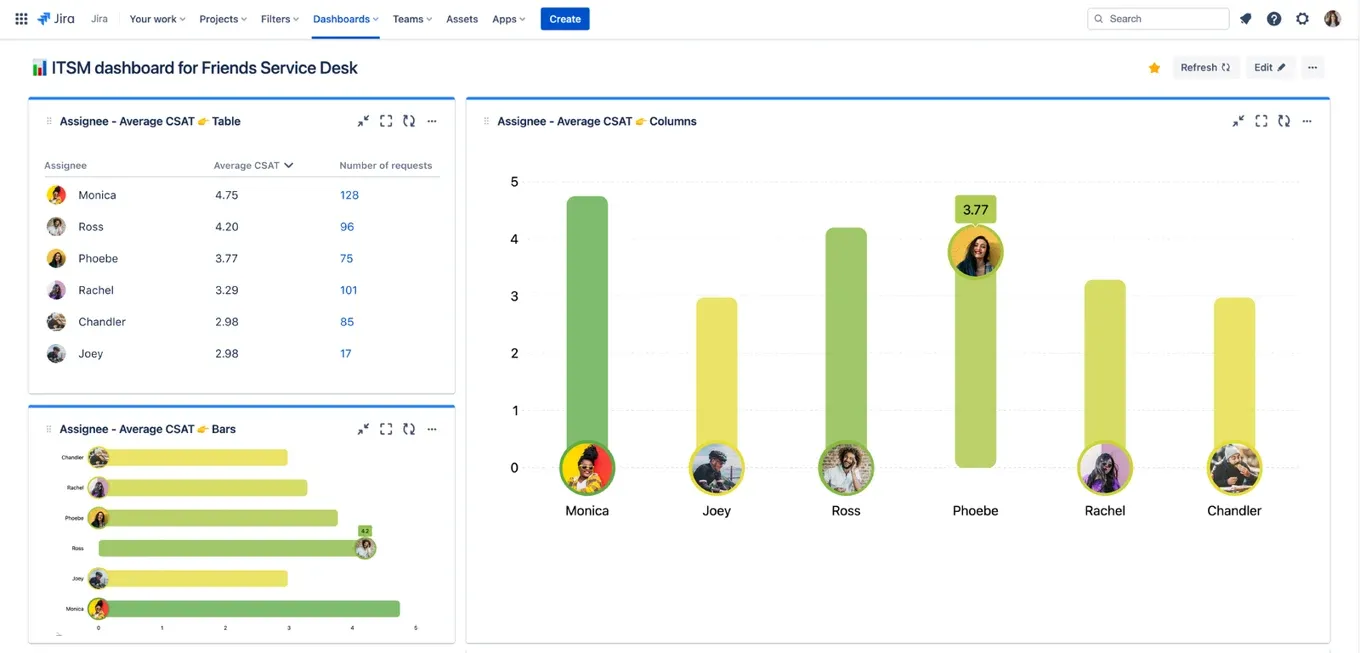
Average CSAT – Customer Satisfaction Score ⭐️
After ticket resolution customers can fill the agents’ evaluation. Monitor those statistics and compare data from different periods and analyze your agent’s performance. Thanks to that you can observe your agents’ scores and allocate them in a more efficient way.
How is it calculated? We take the average CSAT after the current assignee from a certain time.
Customer happiness is a powerful insight that can lead you to optimizing processes and findings that can take your team to the next level of customer support.
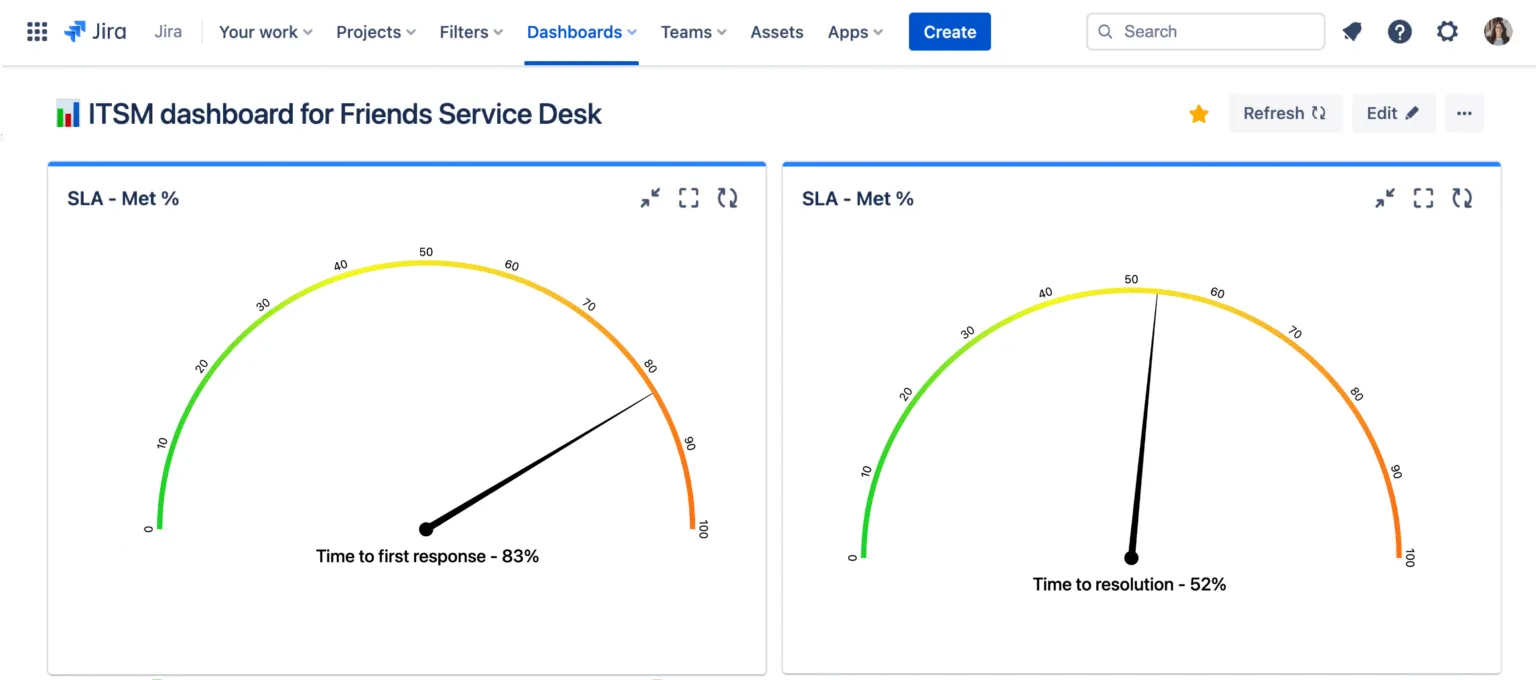
Meeting SLA in percentage 💡
The real nightmare of all team leaders and agents is a queue full of breached SLAs. It takes a clear priorities path and well-organized system to take care of all tickets in exact time.
Don’t wait until your board gets reddish. React when the numbers are heading down and have prepared insights and solutions for your support team. Choose what you need – first time to respond, time to resolution or time to close after resolution – compare data, analyze and draw conclusions that can lead your agents to green light.
How is it calculated? Number of requests with the selected SLA metric met in comparison to all requests from the set period.
Breached SLA’s create chaos. With a service desk report you can assess how the support team is doing. Use information about it and be prepared for incidents. Create a high-velocity team that is highly effective in issue resolving.
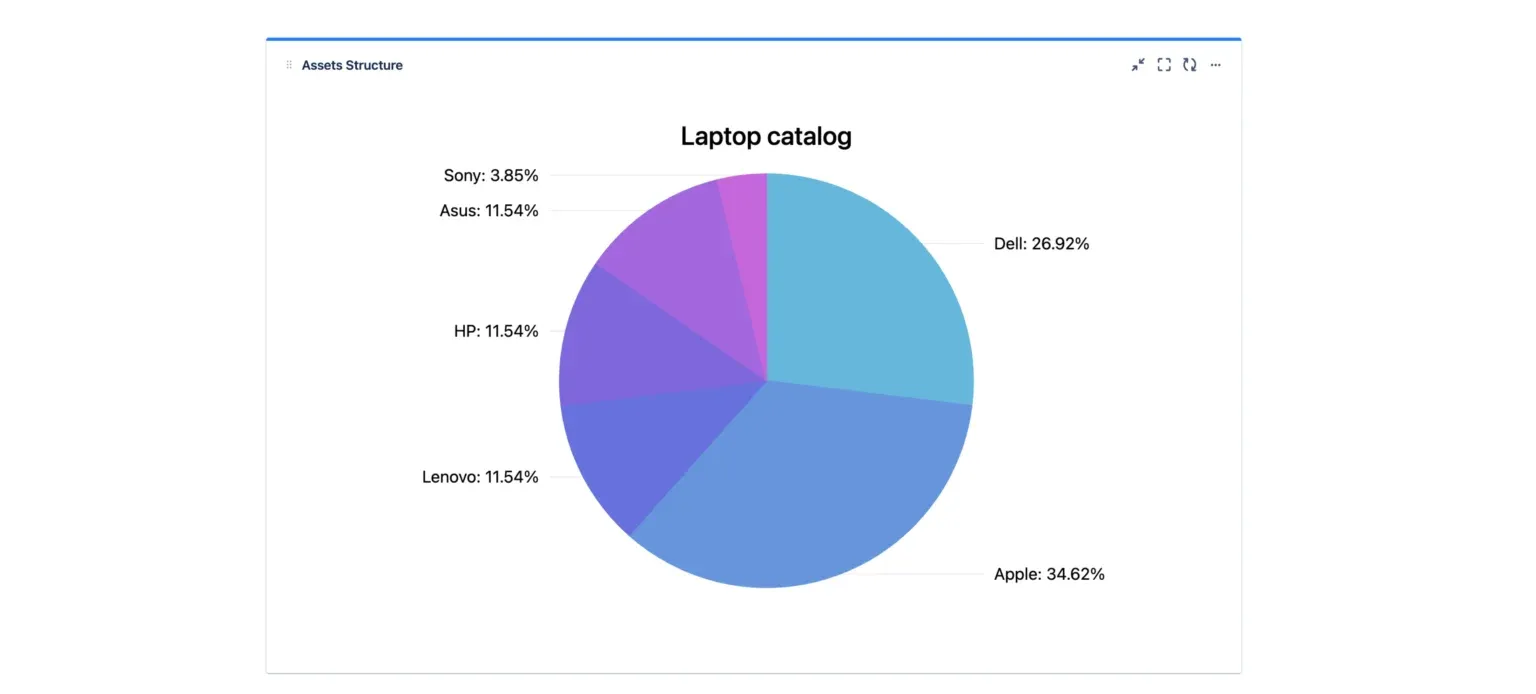
Assets Structure 💻
To optimize corporate returns from its asset base, asset structure understanding is essential. The distribution of the entire asset base among the main asset categories, expressed as a percentage or proportion, is displayed by the asset structure. Take the most of it.
Watch assets distribution and monitor their structure. Have constant access to the current asset base and maximize business return with this knowledge.
Use cases:
- Structure of employees by type of employment
- Structure of laptops and devices in the company based on operating system
- Structure by type of software and licenses in the company
How is it calculated? Assets are segment by object type. You can use AQL to narrow down results.
Conclusion – Why it’s worth it to use ITSM reports
ITSM reports are practical diagrams for service projects. Take the most of Jira Service Management data you already have and gain ready to present and already processed insights.
Benefits of using ITSM reports for service desk:
- Unique service desk data for supporting decisions making,
- Easy to analyze charts and diagrams in native Jira dashboards, so no extra configurations
- Agents’ scoring that leads to improve customer support and your team results,
- Better insights on your team performance, even in many projects
- Time saving with already analyzed and ready to present data at hand,
- Eliminating bottlenecks and workflow issues
- Constant access to the freshest data
- Leaders and managers with powerful data that can skyrocket teams performance
ITSM Reports – Charts, Graphs and Dashboard Gadgets for Jira Service Management is a simple to configure app that can change the way of shaping business processes. As we said, data is powerful – don’t miss the opportunity to stand out.
As this is the very first version of this plugin, we count on you! We can’t wait for your feedback and ideas on how to develop this app further with more reports and extend existing ones. Tell us what you think, and what your needs are.
Related posts
Katarzyna Pawlak
•Mar 20, 2026
Katarzyna Pawlak
•Feb 22, 2026

Katarzyna Pawlak
•Jan 14, 2026


