
Top 5 critical service desk metrics to measure team performance
Read our guide on Top 5 critical service desk metrics to measure team performance on the Appsvio blog.

If you’re not measuring service desk metrics and statistics, this article will explain why you should start. Keep reading to discover how to create service desk reports and what service desk KPI you should keep in mind to boost your team’s performance and gain valuable insights on process productivity.
Bullet points:
- Why should you monitor service desk metrics?
- How to allocate agents efficiently?
- How to find and eliminate bottlenecks in your team?
- Which agent has the lowest CSAT and what should be done with that?
- How to optimize your service desk with numbers?
What are service desk metrics, and why do you need service desk reports?
IT reporting is one of the best practices in the service and technology sector. But why do good leaders monitor numbers and performance?
Data contains powerful insights that allow leaders and managers to improve managed areas. With an analytical approach, you can identify top performers, strengths, weaknesses, and opportunities. It’s also crucial to set the KPIs and goals for your team. Effective performance measurement helps you to avoid incidents and allocate resources better.
Keeping an eye on the service desk metrics will boost your customer support, customer satisfaction, and your agents’ performance. You will gain knowledge of when most incidents happen and why and how to prevent them.
How to create Jira service desk reporting?
Native Jira dashboards with gadgets
You can create some reports in Jira natively, thanks to dashboard functionality. You can choose up to 29 standard gadgets like Activity Stream Gadget or Issue Statistics Gadget. The complete list with the explanation you can find here.
There is also a possibility of creating Jira service desk reporting with dashboards. You can choose between two gadgets:
- Filter counts that works on every project,
- A service project report that displays a custom or knowledge base report from a service project.
If you would like to create a more comprehensive Jira service desk reporting, you can always use extensions like ITSM Reports.
What are service desk metrics?
It’s not rocket science that nowadays, customers expect fast and constantly available customer support. We must adjust to their needs and try to provide the best service possible to keep customers and build their loyalty.
With service desk metrics, you can track your customer support team performance and customer satisfaction, which show you exactly if your strategy works properly to address customers’ needs or if you have to change your approach and optimize this process. Numbers and metrics are crucial to understanding business needs and how we fit in with our services💡
Are service desk metrics the same as the KPIs you set for your team? Not really. KPI is more a goal you aim to achieve in a specific time. It’s something that, in the end, is fulfilled or not.
In contrast, you should monitor the service desk constantly, every day. This is a gauge of your team’s performance and evaluation of the strategy and workflow you built. Thanks to those metrics, you can set a clear KPI for a team.
What are the main service desk metrics for agents?
In short, agents can gather valuable insights into their performance with metrics like average CSAT and SLAs – that sum up their work and customers’ satisfaction. SLA metrics also can show where they have flow problems and what bottlenecks should be fixed.
For leaders, this IT reporting is also crucial to evaluate team members, allocate resources efficiently, and discover the root cause of problems. They can plan long-term strategies and solutions for eliminating incidents and their affection for customers. Statistics like ticket volume or cost per ticket can help to make better business decisions and raise ROI. Also, who wouldn’t know how to minimize incidents and when most happen? It’s all in indicators.
Why should you monitor service desk metrics?
5 main benefits of IT reporting in service desk area.
1. Performance measurement
Reporting allows organizations to measure and monitor the performance of the service desk. Key metrics such as resolution time, ticket volume, and first-call resolution rates provide insights into how well the service desk meets service level agreements (SLAs) and addresses user needs.
2. Resource allocation optimization
Organizations can optimize resource allocation by understanding the workload and resource demands on the service desk. This includes adjusting staffing levels, training programs, and technology investments to meet the actual needs of end-users.
3. Customer satisfaction improvement
Service desk reporting often includes metrics related to user satisfaction. Analyzing these metrics provides insights into the quality of IT services from the user perspective, allowing organizations to make adjustments and improvements to enhance overall user satisfaction.
4. Cost control
Reporting helps manage cost control by clearly showing resource utilization and efficiency. It allows IT leaders to make informed decisions about budget allocation, ensuring that resources are allocated where they are needed most.
5. Root cause analysis
Service desk reports enable IT teams to analyze the root causes of recurring issues. Identifying the underlying causes of problems helps implement long-term solutions, reducing the number of incidents and minimizing their impact on users.
“IT reporting is just like a roadmap in the dev team. It shows us where we are, where we were, and where we’re heading. It is the key to making smart business decisions and staying ahead in the service delivery market. Service desk metrics can only help you address customers’ needs better, which means winning their attention.” Chris Skoropada, Appsvio
Top 5 ITSM metrics of a high-performance service desk
Service desk tickets volume
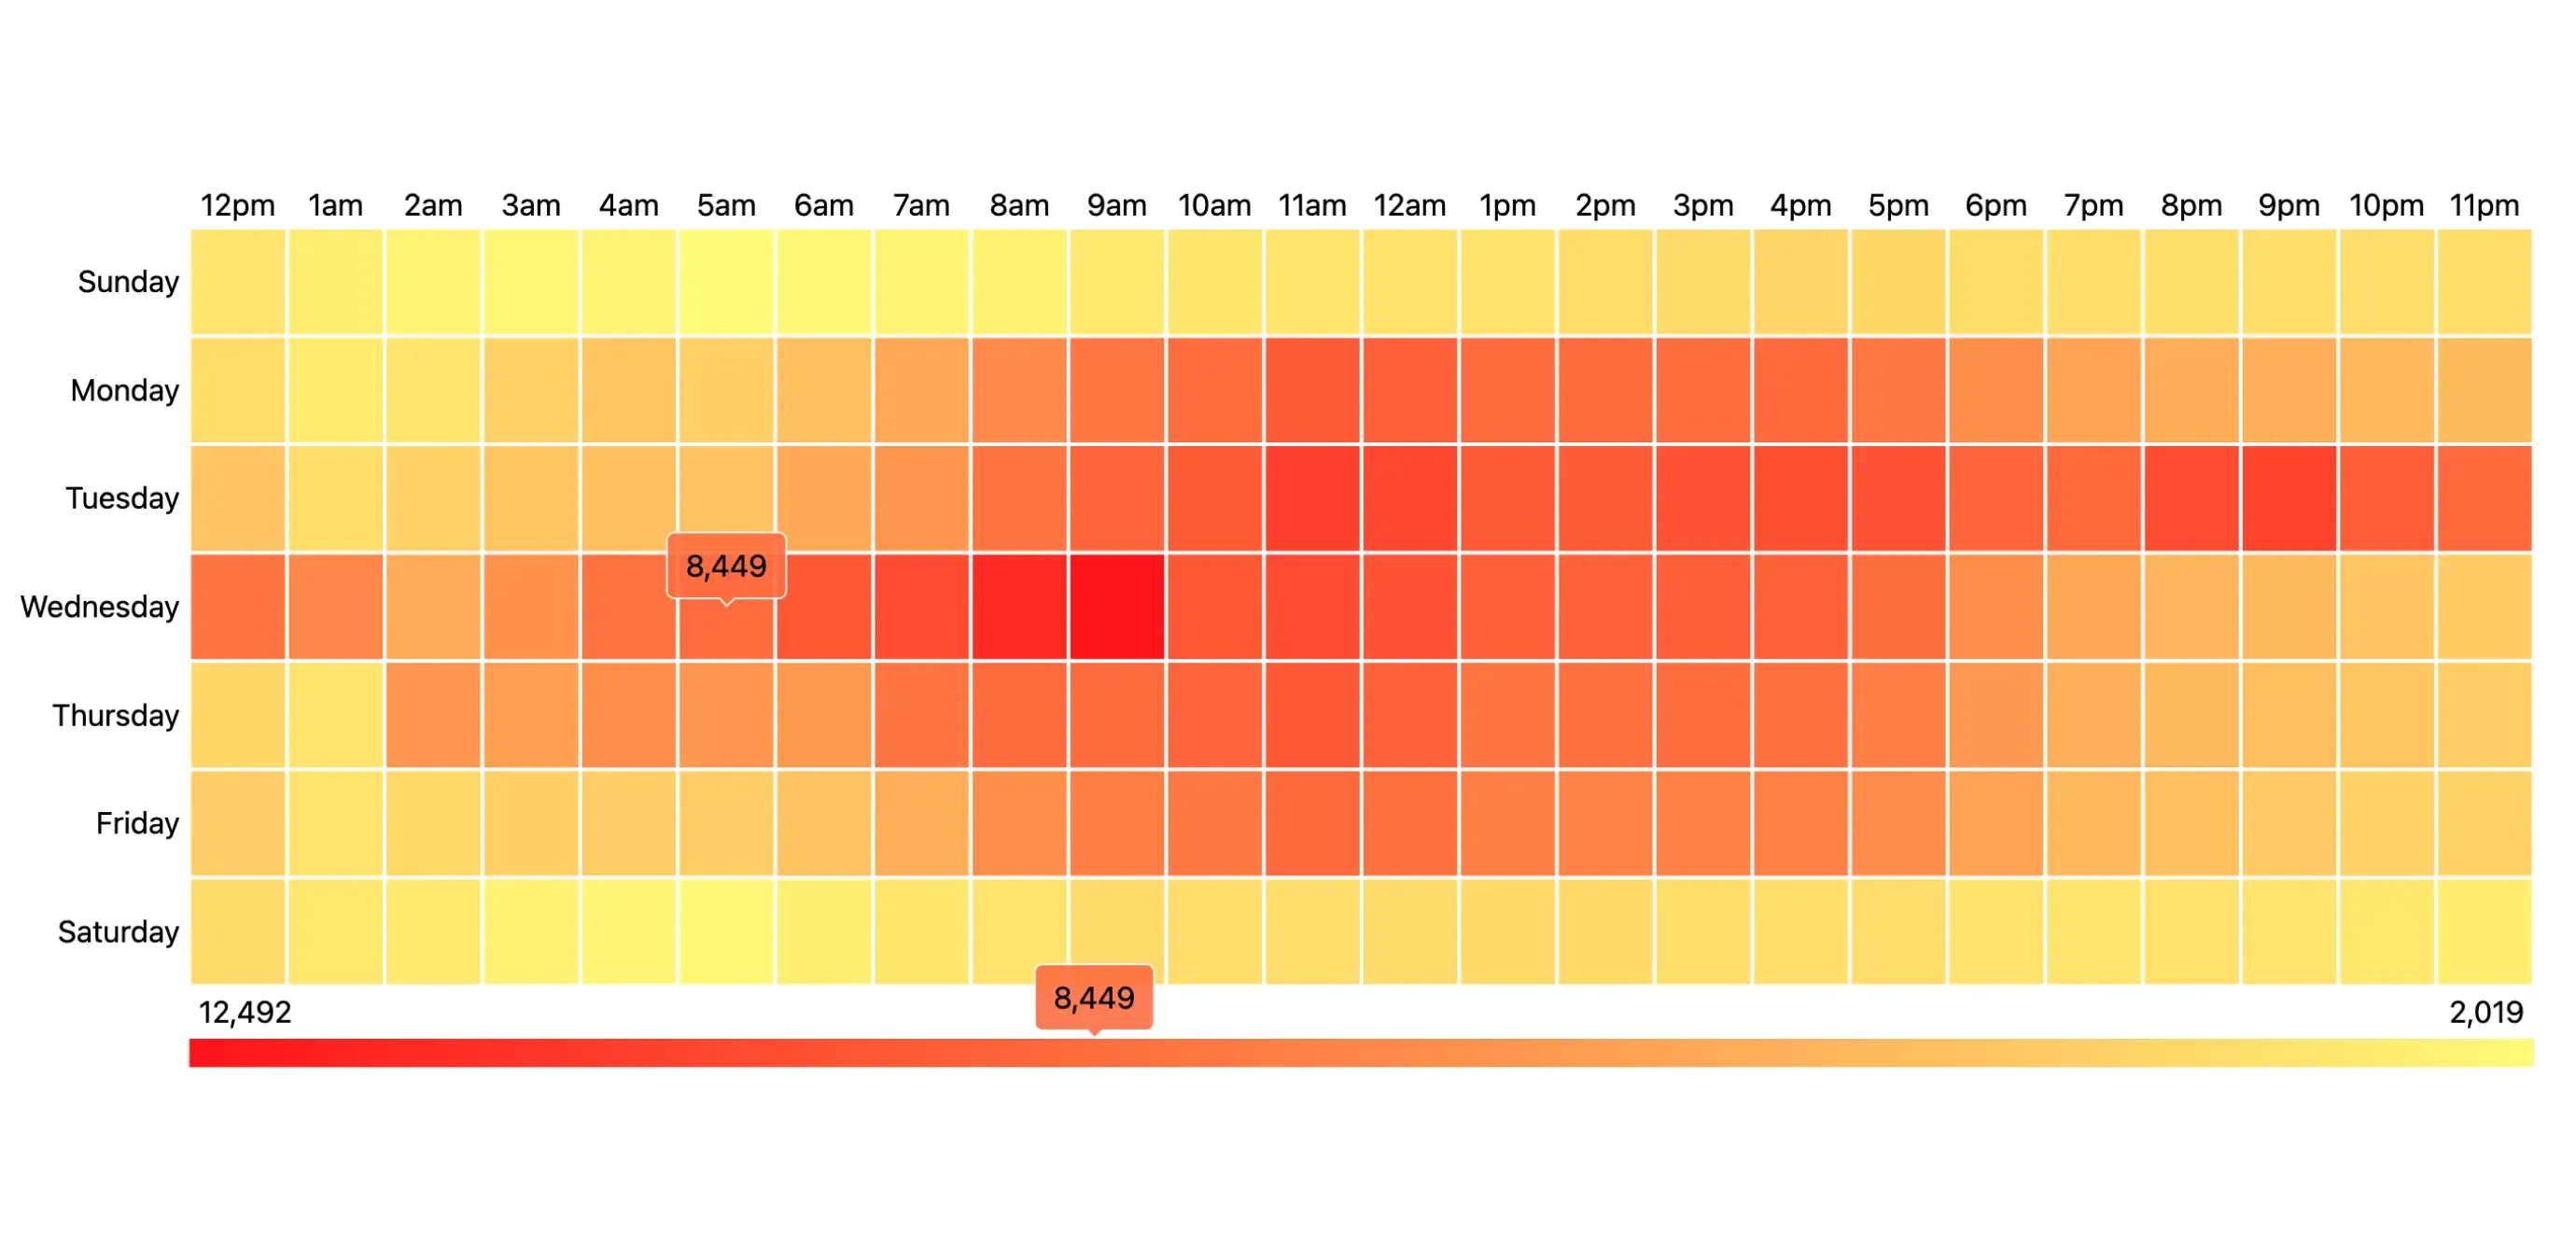
This indicator is the total number of support tickets in a specific time. Monitoring these metrics allows you to predict the most likely time to increase support tickets. If you discover ticket volume patterns, you can allocate agents more efficiently and resolve incidents faster. CSAT will rise due to customer satisfaction, and your board will be managed transparently and without surprising chaos.
For example, you can analyze ticket volume with a heat map like the one below. You can easily spot days and hours with the biggest number of tickets and be ready for it.
SLA in ITSM reports
Service level agreement is a commitment time when agents react to customers’ requests. Evaluate SLA to notice bottlenecks and what takes the most time. Then, you can implement improvement to avoid breached SLA and overloading your agents. Of the standard SLA, two deserve the most attention.
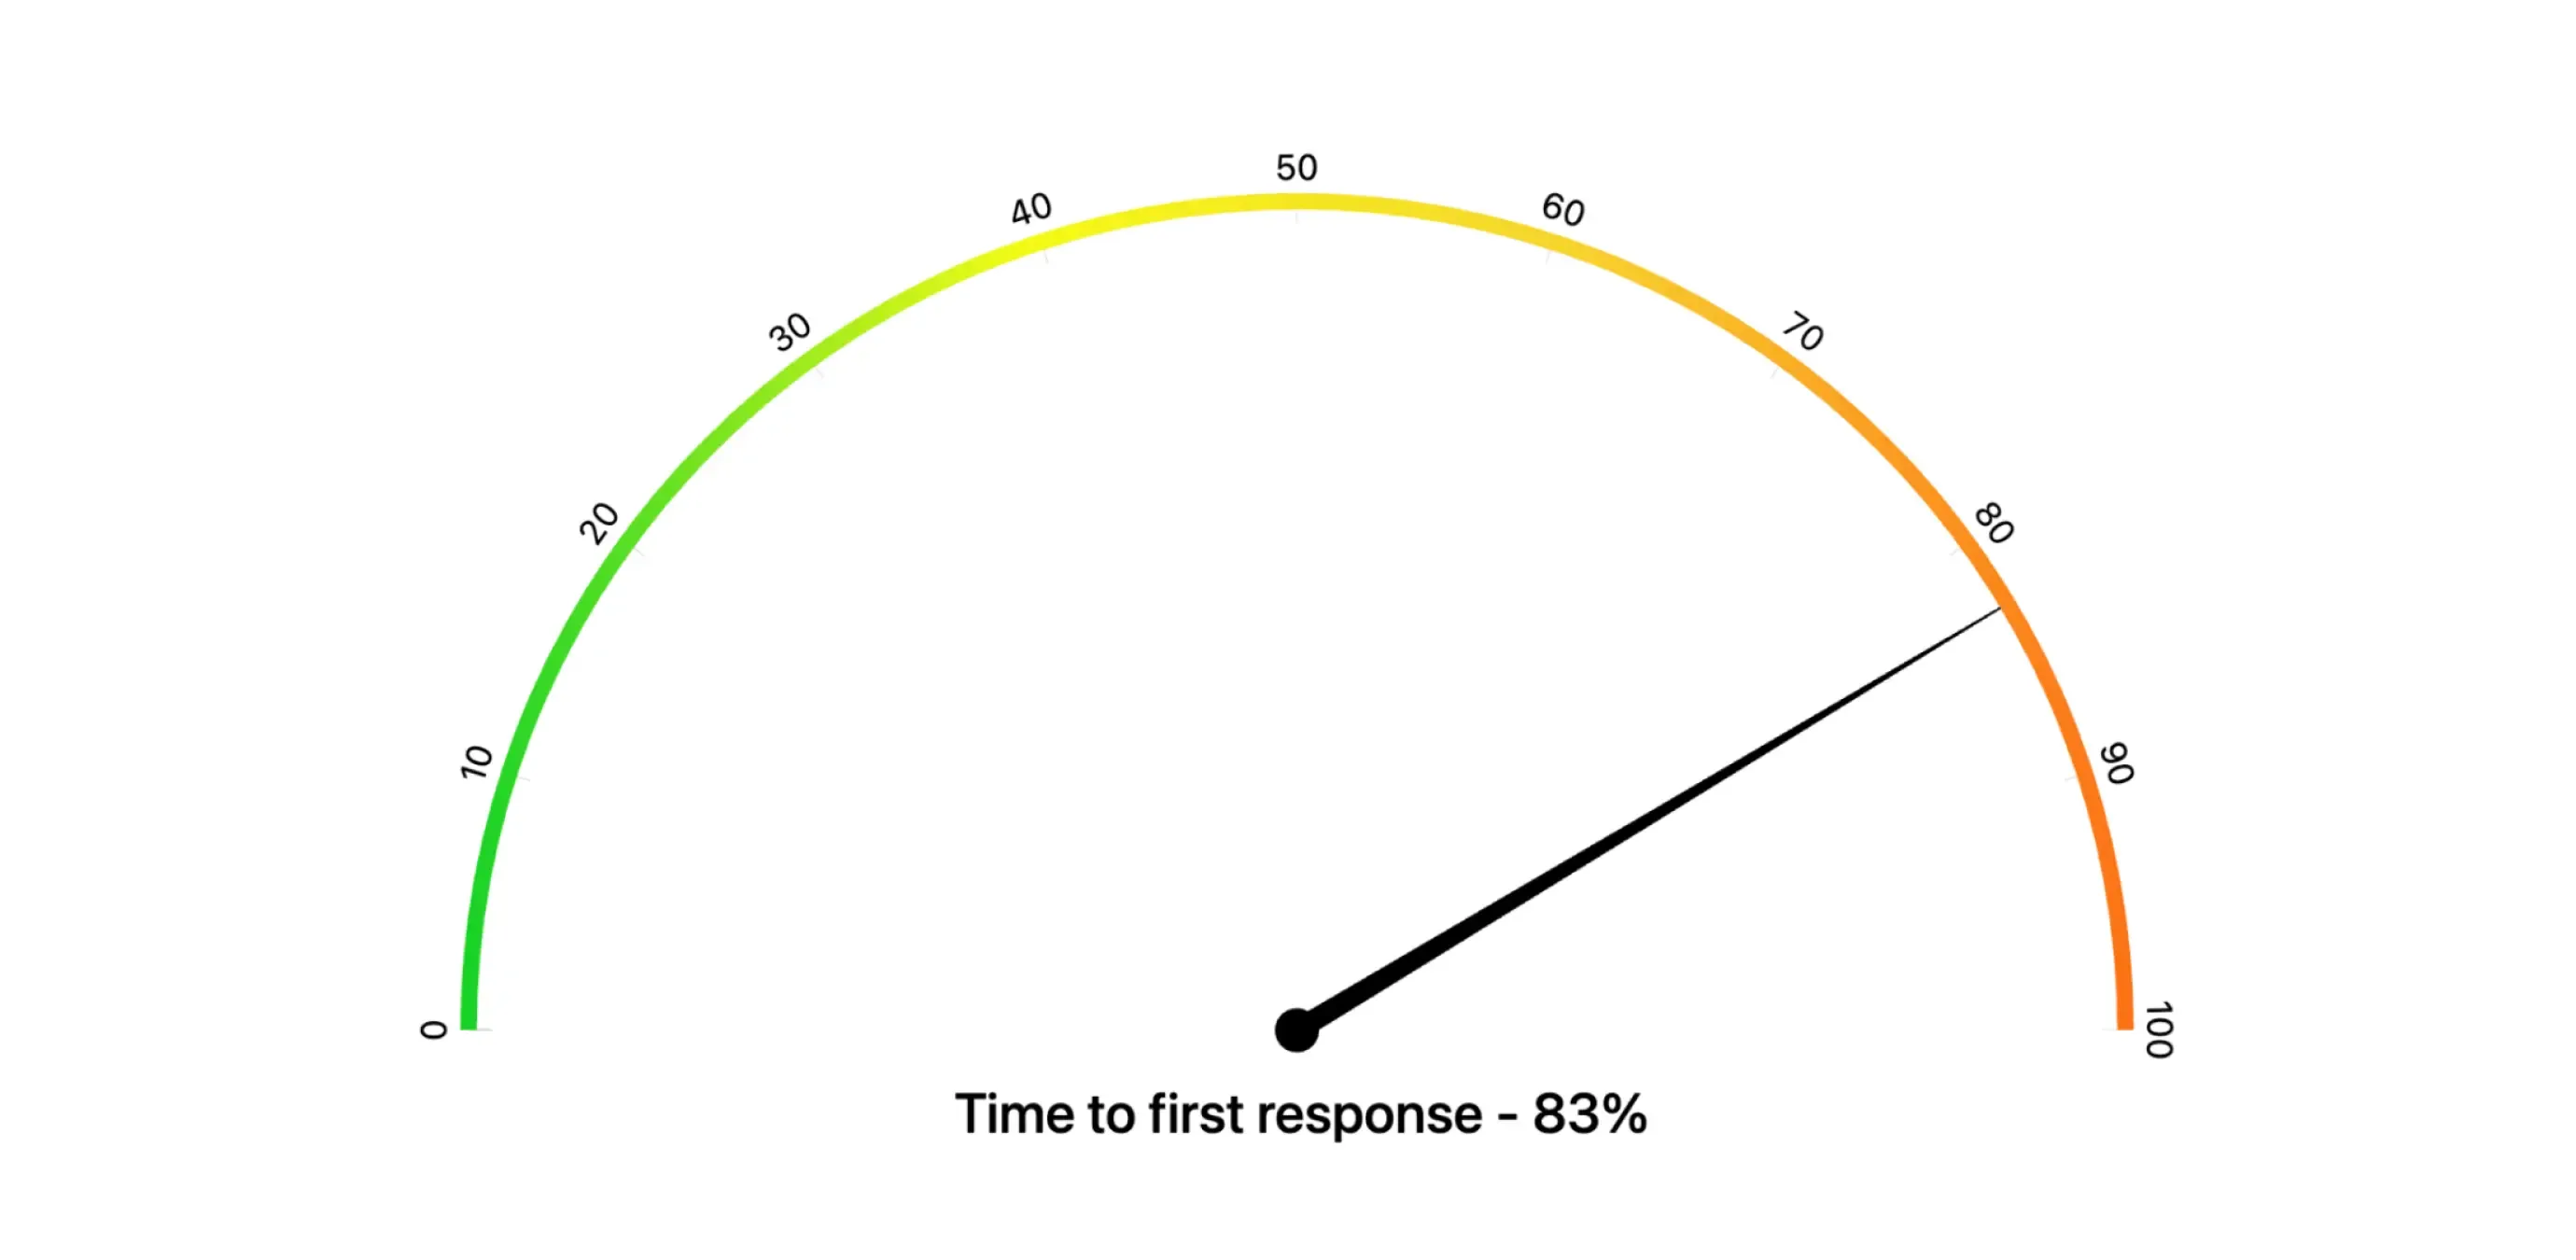
- Time to first response As we said before, customers don’t like to wait. Modern customers need ASAP communication and answers. The longer it takes your service desk agent to respond, the fewer happier customers you get, and this reflects on the efficiency of the company.
If you measure how much percent your team meets time to first response in a specific time and compare it to other periods, you can react immediately when SLA is heading down and spot the issue.
- Time to resolution This SLA reflects the time it takes to resolve a service desk ticket. In this, numbers are considered for all follow-ups, escalations, and changing the statuses backward – all the requests beginning with submitting to closed.
Having extracted data allows you to spot the most extended processes, eliminate stuckness, and decide whether your agents are trained enough.
CSAT as Jira custom report
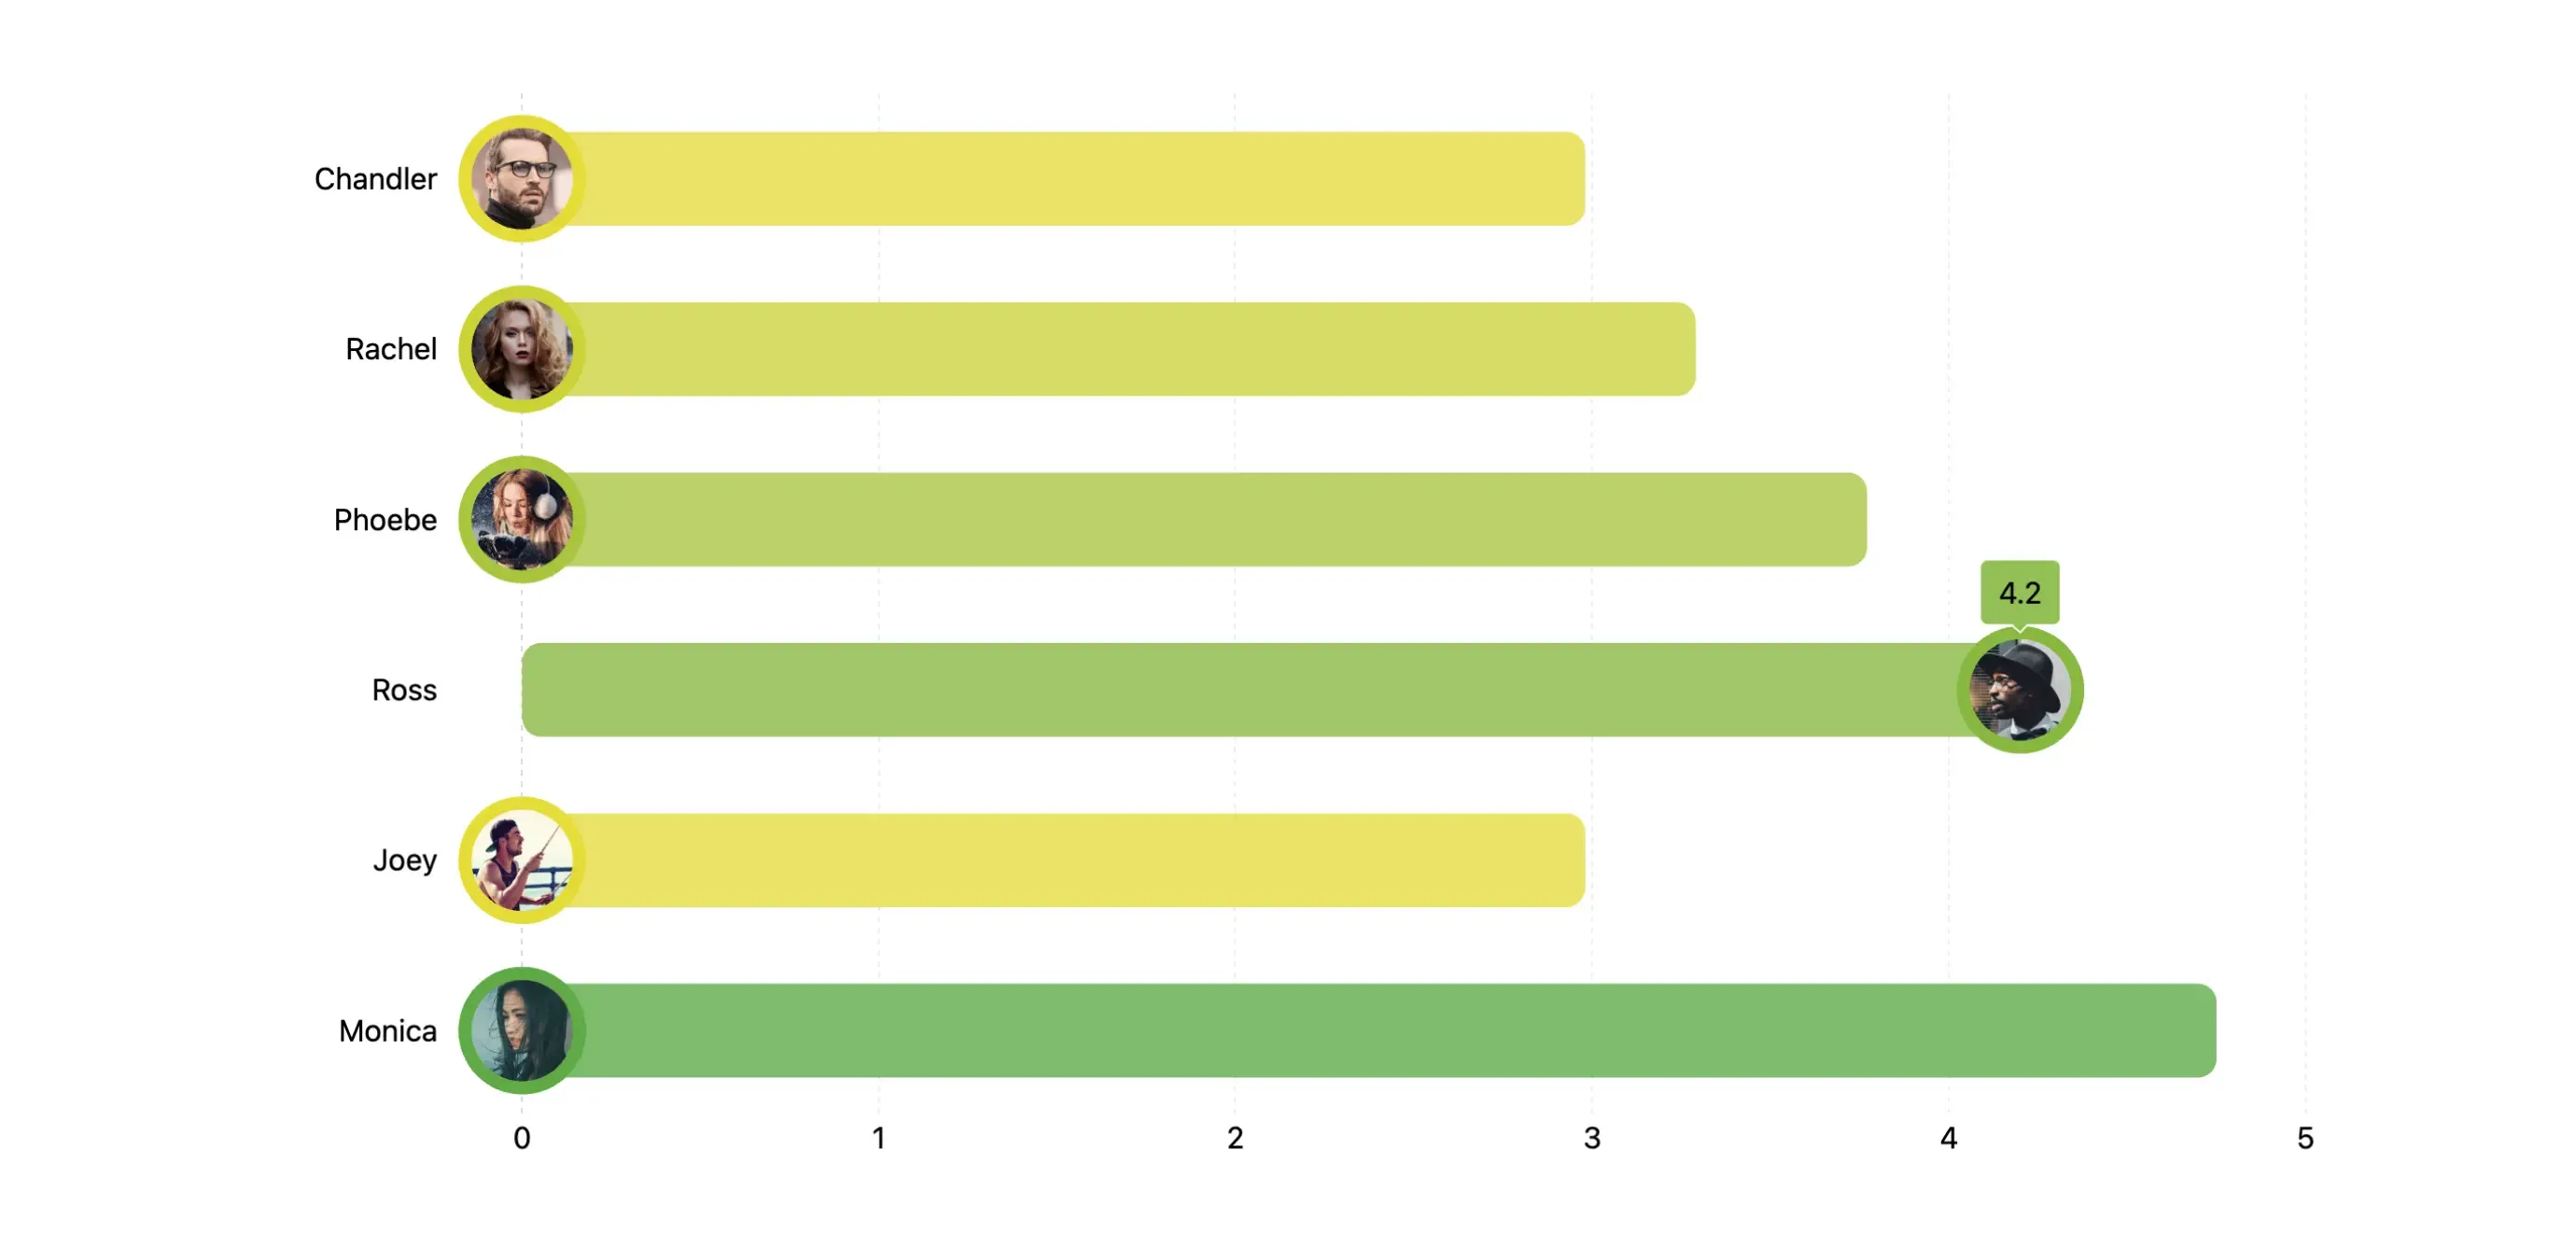
When your agent resolves the ticket, the customer receives an evaluation. If you start monitoring those data and comparing them from different periods, you can gain answers on how to allocate agents more efficiently and where the main bottlenecks are.
Monitoring CSAT reports can tell you who has the highest and lowest results and introduce appropriate steps, such as additional training for agents with lower CSAT scores. This metric calculates the average CSAT after the current assignee over a certain period.
This report is nothing more than an agent performance report, and all managers who care about a high-performance team should keep an eye on it to support their decisions and optimization process.
Cost per ticket
When it comes to financial metrics, this one is the crucial one. It measures the average cost of resolving an IT customer support ticket. If you spot that this cost gets higher, you can reallocate your resources to make it more efficient. These metrics are robust regarding cost reduction optimization and business decision-making.
It is beneficial to track how your optimizations are going. By following the cost per ticket, you can spot the difference and gain insights into whether or not the new strategy works better for financial volume.
Tickets with critical status
Critical incidents are those that block the process. They require immediate resolution because they cause complete dysfunction for customers.
Why evaluate how many critical tickets appeared at a particular time? DevOps leaders should especially monitor it to define the condition of the service. If there is a more and more critical request, it means that our service needs improvement. Also, Dev teams can eliminate bottlenecks, eliminate critical incidents, and monitor new releases.
Key takeaways of Jira service desk reporting
- Unique service desk data for supporting decisions making
- Easy to analyze charts and diagrams in native Jira dashboards, so no extra configurations
- Agents’ scoring that leads to improve customer support and your team results,
- Better insights on your team performance, even in many projects
- Time saving with already analyzed and ready to present data at hand,
- Eliminating bottlenecks and workflow issues
- Constant access to the freshest data
- Leaders and managers with powerful data that can skyrocket teams performance All organizations using the service desk should implement ITSM reporting to be more aware of the condition of their workflow and boost the performance of customer support teams. This will affect customer satisfaction and business conditions.
If you want to implement ITSM reporting in your service desk team, book a demo and learn more about the ITSM Reports app.
Related posts
Katarzyna Pawlak
•Feb 22, 2026
Katarzyna Pawlak
•Jan 14, 2026

Katarzyna Pawlak
•Sep 12, 2025


